weather = readRDS(gzcon(url('https://assets.datacamp.com/production/repositories/34/datasets/b3c1036d9a60a9dfe0f99051d2474a54f76055ea/weather.rds')))Libraries
library(readr)
library(dplyr)
library(lubridate)
library(stringr)
library(installr)
library(tidyr)
Warning message:
"package 'tidyr' was built under R version 3.6.3"# Verify that weather is a data.frame
class(weather)
# Check the dimensions
dim(weather)
# View the column names
names(weather)
'data.frame'
- 286
- 35
- 'X'
- 'year'
- 'month'
- 'measure'
- 'X1'
- 'X2'
- 'X3'
- 'X4'
- 'X5'
- 'X6'
- 'X7'
- 'X8'
- 'X9'
- 'X10'
- 'X11'
- 'X12'
- 'X13'
- 'X14'
- 'X15'
- 'X16'
- 'X17'
- 'X18'
- 'X19'
- 'X20'
- 'X21'
- 'X22'
- 'X23'
- 'X24'
- 'X25'
- 'X26'
- 'X27'
- 'X28'
- 'X29'
- 'X30'
- 'X31'
We’ve confirmed that the object is a data frame with 286 rows and 35 columns.
Summarize the data
Next up is to look at some summaries of the data. This is where functions like str(), glimpse() from dplyr, and summary() come in handy.
# View the structure of the data
str(weather)

# Look at the structure using dplyr's glimpse()
glimpse(weather)

# View a summary of the data
summary(weather)
'data.frame': 286 obs. of 35 variables:
$ X : int 1 2 3 4 5 6 7 8 9 10 ...
$ year : int 2014 2014 2014 2014 2014 2014 2014 2014 2014 2014 ...
$ month : int 12 12 12 12 12 12 12 12 12 12 ...
$ measure: chr "Max.TemperatureF" "Mean.TemperatureF" "Min.TemperatureF" "Max.Dew.PointF" ...
$ X1 : chr "64" "52" "39" "46" ...
$ X2 : chr "42" "38" "33" "40" ...
$ X3 : chr "51" "44" "37" "49" ...
$ X4 : chr "43" "37" "30" "24" ...
$ X5 : chr "42" "34" "26" "37" ...
$ X6 : chr "45" "42" "38" "45" ...
$ X7 : chr "38" "30" "21" "36" ...
$ X8 : chr "29" "24" "18" "28" ...
$ X9 : chr "49" "39" "29" "49" ...
$ X10 : chr "48" "43" "38" "45" ...
$ X11 : chr "39" "36" "32" "37" ...
$ X12 : chr "39" "35" "31" "28" ...
$ X13 : chr "42" "37" "32" "28" ...
$ X14 : chr "45" "39" "33" "29" ...
$ X15 : chr "42" "37" "32" "33" ...
$ X16 : chr "44" "40" "35" "42" ...
$ X17 : chr "49" "45" "41" "46" ...
$ X18 : chr "44" "40" "36" "34" ...
$ X19 : chr "37" "33" "29" "25" ...
$ X20 : chr "36" "32" "27" "30" ...
$ X21 : chr "36" "33" "30" "30" ...
$ X22 : chr "44" "39" "33" "39" ...
$ X23 : chr "47" "45" "42" "45" ...
$ X24 : chr "46" "44" "41" "46" ...
$ X25 : chr "59" "52" "44" "58" ...
$ X26 : chr "50" "44" "37" "31" ...
$ X27 : chr "52" "45" "38" "34" ...
$ X28 : chr "52" "46" "40" "42" ...
$ X29 : chr "41" "36" "30" "26" ...
$ X30 : chr "30" "26" "22" "10" ...
$ X31 : chr "30" "25" "20" "8" ...
Rows: 286
Columns: 35
$ X <int> 1, 2, 3, 4, 5, 6, 7, 8, 9, 10, 11, 12, 13, 14, 15, 16, 17, ...
$ year <int> 2014, 2014, 2014, 2014, 2014, 2014, 2014, 2014, 2014, 2014,...
$ month <int> 12, 12, 12, 12, 12, 12, 12, 12, 12, 12, 12, 12, 12, 12, 12,...
$ measure <chr> "Max.TemperatureF", "Mean.TemperatureF", "Min.TemperatureF"...
$ X1 <chr> "64", "52", "39", "46", "40", "26", "74", "63", "52", "30.4...
$ X2 <chr> "42", "38", "33", "40", "27", "17", "92", "72", "51", "30.7...
$ X3 <chr> "51", "44", "37", "49", "42", "24", "100", "79", "57", "30....
$ X4 <chr> "43", "37", "30", "24", "21", "13", "69", "54", "39", "30.5...
$ X5 <chr> "42", "34", "26", "37", "25", "12", "85", "66", "47", "30.6...
$ X6 <chr> "45", "42", "38", "45", "40", "36", "100", "93", "85", "30....
$ X7 <chr> "38", "30", "21", "36", "20", "-3", "92", "61", "29", "30.6...
$ X8 <chr> "29", "24", "18", "28", "16", "3", "92", "70", "47", "30.77...
$ X9 <chr> "49", "39", "29", "49", "41", "28", "100", "93", "86", "30....
$ X10 <chr> "48", "43", "38", "45", "39", "37", "100", "95", "89", "29....
$ X11 <chr> "39", "36", "32", "37", "31", "27", "92", "87", "82", "29.8...
$ X12 <chr> "39", "35", "31", "28", "27", "25", "85", "75", "64", "29.8...
$ X13 <chr> "42", "37", "32", "28", "26", "24", "75", "65", "55", "29.8...
$ X14 <chr> "45", "39", "33", "29", "27", "25", "82", "68", "53", "29.9...
$ X15 <chr> "42", "37", "32", "33", "29", "27", "89", "75", "60", "30.1...
$ X16 <chr> "44", "40", "35", "42", "36", "30", "96", "85", "73", "30.1...
$ X17 <chr> "49", "45", "41", "46", "41", "32", "100", "85", "70", "29....
$ X18 <chr> "44", "40", "36", "34", "30", "26", "89", "73", "57", "29.8...
$ X19 <chr> "37", "33", "29", "25", "22", "20", "69", "63", "56", "30.1...
$ X20 <chr> "36", "32", "27", "30", "24", "20", "89", "79", "69", "30.3...
$ X21 <chr> "36", "33", "30", "30", "27", "25", "85", "77", "69", "30.3...
$ X22 <chr> "44", "39", "33", "39", "34", "25", "89", "79", "69", "30.4...
$ X23 <chr> "47", "45", "42", "45", "42", "37", "100", "91", "82", "30....
$ X24 <chr> "46", "44", "41", "46", "44", "41", "100", "98", "96", "30....
$ X25 <chr> "59", "52", "44", "58", "43", "29", "100", "75", "49", "29....
$ X26 <chr> "50", "44", "37", "31", "29", "28", "70", "60", "49", "30.1...
$ X27 <chr> "52", "45", "38", "34", "31", "29", "70", "60", "50", "30.2...
$ X28 <chr> "52", "46", "40", "42", "35", "27", "76", "65", "53", "29.9...
$ X29 <chr> "41", "36", "30", "26", "20", "10", "64", "51", "37", "30.2...
$ X30 <chr> "30", "26", "22", "10", "4", "-6", "50", "38", "26", "30.36...
$ X31 <chr> "30", "25", "20", "8", "5", "1", "57", "44", "31", "30.32",... X year month measure
Min. : 1.00 Min. :2014 Min. : 1.000 Length:286
1st Qu.: 72.25 1st Qu.:2015 1st Qu.: 4.000 Class :character
Median :143.50 Median :2015 Median : 7.000 Mode :character
Mean :143.50 Mean :2015 Mean : 6.923
3rd Qu.:214.75 3rd Qu.:2015 3rd Qu.:10.000
Max. :286.00 Max. :2015 Max. :12.000
X1 X2 X3 X4
Length:286 Length:286 Length:286 Length:286
Class :character Class :character Class :character Class :character
Mode :character Mode :character Mode :character Mode :character
X5 X6 X7 X8
Length:286 Length:286 Length:286 Length:286
Class :character Class :character Class :character Class :character
Mode :character Mode :character Mode :character Mode :character
X9 X10 X11 X12
Length:286 Length:286 Length:286 Length:286
Class :character Class :character Class :character Class :character
Mode :character Mode :character Mode :character Mode :character
X13 X14 X15 X16
Length:286 Length:286 Length:286 Length:286
Class :character Class :character Class :character Class :character
Mode :character Mode :character Mode :character Mode :character
X17 X18 X19 X20
Length:286 Length:286 Length:286 Length:286
Class :character Class :character Class :character Class :character
Mode :character Mode :character Mode :character Mode :character
X21 X22 X23 X24
Length:286 Length:286 Length:286 Length:286
Class :character Class :character Class :character Class :character
Mode :character Mode :character Mode :character Mode :character
X25 X26 X27 X28
Length:286 Length:286 Length:286 Length:286
Class :character Class :character Class :character Class :character
Mode :character Mode :character Mode :character Mode :character
X29 X30 X31
Length:286 Length:286 Length:286
Class :character Class :character Class :character
Mode :character Mode :character Mode :character
Now that we have a pretty good feel for how the table is structured, we’ll take a look at some real observations!
Take a closer look
After understanding the structure of the data and looking at some brief summaries, it often helps to preview the actual data. The functions head() and tail() allow us to view the top and bottom rows of the data, respectively.
# View first 6 rows
head(weather)

# View first 15 rows
head(weather, n=15)

# View the last 6 rows
tail(weather)

# View the last 10 rows
tail(weather, n=10)| X | year | month | measure | X1 | X2 | X3 | X4 | X5 | X6 | ... | X22 | X23 | X24 | X25 | X26 | X27 | X28 | X29 | X30 | X31 |
|---|---|---|---|---|---|---|---|---|---|---|---|---|---|---|---|---|---|---|---|---|
| 1 | 2014 | 12 | Max.TemperatureF | 64 | 42 | 51 | 43 | 42 | 45 | ... | 44 | 47 | 46 | 59 | 50 | 52 | 52 | 41 | 30 | 30 |
| 2 | 2014 | 12 | Mean.TemperatureF | 52 | 38 | 44 | 37 | 34 | 42 | ... | 39 | 45 | 44 | 52 | 44 | 45 | 46 | 36 | 26 | 25 |
| 3 | 2014 | 12 | Min.TemperatureF | 39 | 33 | 37 | 30 | 26 | 38 | ... | 33 | 42 | 41 | 44 | 37 | 38 | 40 | 30 | 22 | 20 |
| 4 | 2014 | 12 | Max.Dew.PointF | 46 | 40 | 49 | 24 | 37 | 45 | ... | 39 | 45 | 46 | 58 | 31 | 34 | 42 | 26 | 10 | 8 |
| 5 | 2014 | 12 | MeanDew.PointF | 40 | 27 | 42 | 21 | 25 | 40 | ... | 34 | 42 | 44 | 43 | 29 | 31 | 35 | 20 | 4 | 5 |
| 6 | 2014 | 12 | Min.DewpointF | 26 | 17 | 24 | 13 | 12 | 36 | ... | 25 | 37 | 41 | 29 | 28 | 29 | 27 | 10 | -6 | 1 |
| X | year | month | measure | X1 | X2 | X3 | X4 | X5 | X6 | ... | X22 | X23 | X24 | X25 | X26 | X27 | X28 | X29 | X30 | X31 |
|---|---|---|---|---|---|---|---|---|---|---|---|---|---|---|---|---|---|---|---|---|
| 1 | 2014 | 12 | Max.TemperatureF | 64 | 42 | 51 | 43 | 42 | 45 | ... | 44 | 47 | 46 | 59 | 50 | 52 | 52 | 41 | 30 | 30 |
| 2 | 2014 | 12 | Mean.TemperatureF | 52 | 38 | 44 | 37 | 34 | 42 | ... | 39 | 45 | 44 | 52 | 44 | 45 | 46 | 36 | 26 | 25 |
| 3 | 2014 | 12 | Min.TemperatureF | 39 | 33 | 37 | 30 | 26 | 38 | ... | 33 | 42 | 41 | 44 | 37 | 38 | 40 | 30 | 22 | 20 |
| 4 | 2014 | 12 | Max.Dew.PointF | 46 | 40 | 49 | 24 | 37 | 45 | ... | 39 | 45 | 46 | 58 | 31 | 34 | 42 | 26 | 10 | 8 |
| 5 | 2014 | 12 | MeanDew.PointF | 40 | 27 | 42 | 21 | 25 | 40 | ... | 34 | 42 | 44 | 43 | 29 | 31 | 35 | 20 | 4 | 5 |
| 6 | 2014 | 12 | Min.DewpointF | 26 | 17 | 24 | 13 | 12 | 36 | ... | 25 | 37 | 41 | 29 | 28 | 29 | 27 | 10 | -6 | 1 |
| 7 | 2014 | 12 | Max.Humidity | 74 | 92 | 100 | 69 | 85 | 100 | ... | 89 | 100 | 100 | 100 | 70 | 70 | 76 | 64 | 50 | 57 |
| 8 | 2014 | 12 | Mean.Humidity | 63 | 72 | 79 | 54 | 66 | 93 | ... | 79 | 91 | 98 | 75 | 60 | 60 | 65 | 51 | 38 | 44 |
| 9 | 2014 | 12 | Min.Humidity | 52 | 51 | 57 | 39 | 47 | 85 | ... | 69 | 82 | 96 | 49 | 49 | 50 | 53 | 37 | 26 | 31 |
| 10 | 2014 | 12 | Max.Sea.Level.PressureIn | 30.45 | 30.71 | 30.4 | 30.56 | 30.68 | 30.42 | ... | 30.4 | 30.31 | 30.13 | 29.96 | 30.16 | 30.22 | 29.99 | 30.22 | 30.36 | 30.32 |
| 11 | 2014 | 12 | Mean.Sea.Level.PressureIn | 30.13 | 30.59 | 30.07 | 30.33 | 30.59 | 30.24 | ... | 30.35 | 30.23 | 29.9 | 29.63 | 30.11 | 30.14 | 29.87 | 30.12 | 30.32 | 30.25 |
| 12 | 2014 | 12 | Min.Sea.Level.PressureIn | 30.01 | 30.4 | 29.87 | 30.09 | 30.45 | 30.16 | ... | 30.3 | 30.16 | 29.55 | 29.47 | 29.99 | 30.03 | 29.77 | 30 | 30.23 | 30.13 |
| 13 | 2014 | 12 | Max.VisibilityMiles | 10 | 10 | 10 | 10 | 10 | 10 | ... | 10 | 10 | 2 | 10 | 10 | 10 | 10 | 10 | 10 | 10 |
| 14 | 2014 | 12 | Mean.VisibilityMiles | 10 | 8 | 5 | 10 | 10 | 4 | ... | 10 | 5 | 1 | 8 | 10 | 10 | 10 | 10 | 10 | 10 |
| 15 | 2014 | 12 | Min.VisibilityMiles | 10 | 2 | 1 | 10 | 5 | 0 | ... | 4 | 1 | 0 | 1 | 10 | 10 | 10 | 10 | 10 | 10 |
| X | year | month | measure | X1 | X2 | X3 | X4 | X5 | X6 | ... | X22 | X23 | X24 | X25 | X26 | X27 | X28 | X29 | X30 | X31 | |
|---|---|---|---|---|---|---|---|---|---|---|---|---|---|---|---|---|---|---|---|---|---|
| 281 | 281 | 2015 | 12 | Mean.Wind.SpeedMPH | 6 | NA | NA | NA | NA | NA | ... | NA | NA | NA | NA | NA | NA | NA | NA | NA | NA |
| 282 | 282 | 2015 | 12 | Max.Gust.SpeedMPH | 17 | NA | NA | NA | NA | NA | ... | NA | NA | NA | NA | NA | NA | NA | NA | NA | NA |
| 283 | 283 | 2015 | 12 | PrecipitationIn | 0.14 | NA | NA | NA | NA | NA | ... | NA | NA | NA | NA | NA | NA | NA | NA | NA | NA |
| 284 | 284 | 2015 | 12 | CloudCover | 7 | NA | NA | NA | NA | NA | ... | NA | NA | NA | NA | NA | NA | NA | NA | NA | NA |
| 285 | 285 | 2015 | 12 | Events | Rain | NA | NA | NA | NA | NA | ... | NA | NA | NA | NA | NA | NA | NA | NA | NA | NA |
| 286 | 286 | 2015 | 12 | WindDirDegrees | 109 | NA | NA | NA | NA | NA | ... | NA | NA | NA | NA | NA | NA | NA | NA | NA | NA |
| X | year | month | measure | X1 | X2 | X3 | X4 | X5 | X6 | ... | X22 | X23 | X24 | X25 | X26 | X27 | X28 | X29 | X30 | X31 | |
|---|---|---|---|---|---|---|---|---|---|---|---|---|---|---|---|---|---|---|---|---|---|
| 277 | 277 | 2015 | 12 | Max.VisibilityMiles | 10 | NA | NA | NA | NA | NA | ... | NA | NA | NA | NA | NA | NA | NA | NA | NA | NA |
| 278 | 278 | 2015 | 12 | Mean.VisibilityMiles | 8 | NA | NA | NA | NA | NA | ... | NA | NA | NA | NA | NA | NA | NA | NA | NA | NA |
| 279 | 279 | 2015 | 12 | Min.VisibilityMiles | 1 | NA | NA | NA | NA | NA | ... | NA | NA | NA | NA | NA | NA | NA | NA | NA | NA |
| 280 | 280 | 2015 | 12 | Max.Wind.SpeedMPH | 15 | NA | NA | NA | NA | NA | ... | NA | NA | NA | NA | NA | NA | NA | NA | NA | NA |
| 281 | 281 | 2015 | 12 | Mean.Wind.SpeedMPH | 6 | NA | NA | NA | NA | NA | ... | NA | NA | NA | NA | NA | NA | NA | NA | NA | NA |
| 282 | 282 | 2015 | 12 | Max.Gust.SpeedMPH | 17 | NA | NA | NA | NA | NA | ... | NA | NA | NA | NA | NA | NA | NA | NA | NA | NA |
| 283 | 283 | 2015 | 12 | PrecipitationIn | 0.14 | NA | NA | NA | NA | NA | ... | NA | NA | NA | NA | NA | NA | NA | NA | NA | NA |
| 284 | 284 | 2015 | 12 | CloudCover | 7 | NA | NA | NA | NA | NA | ... | NA | NA | NA | NA | NA | NA | NA | NA | NA | NA |
| 285 | 285 | 2015 | 12 | Events | Rain | NA | NA | NA | NA | NA | ... | NA | NA | NA | NA | NA | NA | NA | NA | NA | NA |
| 286 | 286 | 2015 | 12 | WindDirDegrees | 109 | NA | NA | NA | NA | NA | ... | NA | NA | NA | NA | NA | NA | NA | NA | NA | NA |
Let’s tidy the data
Column names are values
The weather dataset suffers from one of the five most common symptoms of messy data: column names are values. In particular, the column names X1-X31 represent days of the month, which should really be values of a new variable called day.
The tidyr package provides the gather() function for exactly this scenario.
gather(df, time, val, t1:t3)
gather()allows us to select multiple columns to be gathered by using the:operator.
# Gather the columns
weather2 <- gather(weather, day, value, X1:X31, na.rm = TRUE)

# View the head
head(weather2)| X | year | month | measure | day | value |
|---|---|---|---|---|---|
| 1 | 2014 | 12 | Max.TemperatureF | X1 | 64 |
| 2 | 2014 | 12 | Mean.TemperatureF | X1 | 52 |
| 3 | 2014 | 12 | Min.TemperatureF | X1 | 39 |
| 4 | 2014 | 12 | Max.Dew.PointF | X1 | 46 |
| 5 | 2014 | 12 | MeanDew.PointF | X1 | 40 |
| 6 | 2014 | 12 | Min.DewpointF | X1 | 26 |
Values are variable names
Our data suffer from a second common symptom of messy data: values are variable names. Specifically, values in the measure column should be variables (i.e. column names) in our dataset.
The spread() function from tidyr is designed to help with this.
spread(df2, time, val)# First remove column of row names
without_x <- weather2[, -1]
# Spread the data
weather3 <- spread(without_x, measure, value)
# View the head
head(weather3)| year | month | day | CloudCover | Events | Max.Dew.PointF | Max.Gust.SpeedMPH | Max.Humidity | Max.Sea.Level.PressureIn | Max.TemperatureF | ... | Mean.VisibilityMiles | Mean.Wind.SpeedMPH | MeanDew.PointF | Min.DewpointF | Min.Humidity | Min.Sea.Level.PressureIn | Min.TemperatureF | Min.VisibilityMiles | PrecipitationIn | WindDirDegrees |
|---|---|---|---|---|---|---|---|---|---|---|---|---|---|---|---|---|---|---|---|---|
| 2014 | 12 | X1 | 6 | Rain | 46 | 29 | 74 | 30.45 | 64 | ... | 10 | 13 | 40 | 26 | 52 | 30.01 | 39 | 10 | 0.01 | 268 |
| 2014 | 12 | X10 | 8 | Rain | 45 | 29 | 100 | 29.58 | 48 | ... | 3 | 13 | 39 | 37 | 89 | 29.43 | 38 | 1 | 0.28 | 357 |
| 2014 | 12 | X11 | 8 | Rain-Snow | 37 | 28 | 92 | 29.81 | 39 | ... | 7 | 13 | 31 | 27 | 82 | 29.44 | 32 | 1 | 0.02 | 230 |
| 2014 | 12 | X12 | 7 | Snow | 28 | 21 | 85 | 29.88 | 39 | ... | 10 | 11 | 27 | 25 | 64 | 29.81 | 31 | 7 | T | 286 |
| 2014 | 12 | X13 | 5 | 28 | 23 | 75 | 29.86 | 42 | ... | 10 | 12 | 26 | 24 | 55 | 29.78 | 32 | 10 | T | 298 | |
| 2014 | 12 | X14 | 4 | 29 | 20 | 82 | 29.91 | 45 | ... | 10 | 10 | 27 | 25 | 53 | 29.78 | 33 | 10 | 0.00 | 306 |
This dataset is looking much better already!
Prepare the data for analysis
Clean up dates
Now that the weather dataset adheres to tidy data principles, the next step is to prepare it for analysis. We’ll start by combining the year, month, and day columns and recoding the resulting character column as a date. We can use a combination of base R, stringr, and lubridate to accomplish this task.
# Remove X's from day column
weather3$day <- str_replace(weather3$day, 'X', '')

# Unite the year, month, and day columns
weather4 <- unite(weather3, date, year, month, day, sep = "-")

# Convert date column to proper date format using lubridates's ymd()
weather4$date <- ymd(weather4$date)

# Rearrange columns using dplyr's select()
weather5 <- select(weather4, date, Events, CloudCover:WindDirDegrees)

# View the head of weather5
head(weather5)| date | Events | CloudCover | Max.Dew.PointF | Max.Gust.SpeedMPH | Max.Humidity | Max.Sea.Level.PressureIn | Max.TemperatureF | Max.VisibilityMiles | Max.Wind.SpeedMPH | ... | Mean.VisibilityMiles | Mean.Wind.SpeedMPH | MeanDew.PointF | Min.DewpointF | Min.Humidity | Min.Sea.Level.PressureIn | Min.TemperatureF | Min.VisibilityMiles | PrecipitationIn | WindDirDegrees |
|---|---|---|---|---|---|---|---|---|---|---|---|---|---|---|---|---|---|---|---|---|
| 2014-12-01 | Rain | 6 | 46 | 29 | 74 | 30.45 | 64 | 10 | 22 | ... | 10 | 13 | 40 | 26 | 52 | 30.01 | 39 | 10 | 0.01 | 268 |
| 2014-12-10 | Rain | 8 | 45 | 29 | 100 | 29.58 | 48 | 10 | 23 | ... | 3 | 13 | 39 | 37 | 89 | 29.43 | 38 | 1 | 0.28 | 357 |
| 2014-12-11 | Rain-Snow | 8 | 37 | 28 | 92 | 29.81 | 39 | 10 | 21 | ... | 7 | 13 | 31 | 27 | 82 | 29.44 | 32 | 1 | 0.02 | 230 |
| 2014-12-12 | Snow | 7 | 28 | 21 | 85 | 29.88 | 39 | 10 | 16 | ... | 10 | 11 | 27 | 25 | 64 | 29.81 | 31 | 7 | T | 286 |
| 2014-12-13 | 5 | 28 | 23 | 75 | 29.86 | 42 | 10 | 17 | ... | 10 | 12 | 26 | 24 | 55 | 29.78 | 32 | 10 | T | 298 | |
| 2014-12-14 | 4 | 29 | 20 | 82 | 29.91 | 45 | 10 | 15 | ... | 10 | 10 | 27 | 25 | 53 | 29.78 | 33 | 10 | 0.00 | 306 |
A closer look at column types
It’s important for analysis that variables are coded appropriately. This is not yet the case with our weather data.
# View the structure of weather5
str(weather5)

# Examine the first 20 rows of weather5. Are most of the characters numeric?
head(weather5, 20)

# See what happens if we try to convert PrecipitationIn to numeric
as.numeric(weather5$PrecipitationIn)
'data.frame': 366 obs. of 23 variables:
$ date : Date, format: "2014-12-01" "2014-12-10" ...
$ Events : chr "Rain" "Rain" "Rain-Snow" "Snow" ...
$ CloudCover : chr "6" "8" "8" "7" ...
$ Max.Dew.PointF : chr "46" "45" "37" "28" ...
$ Max.Gust.SpeedMPH : chr "29" "29" "28" "21" ...
$ Max.Humidity : chr "74" "100" "92" "85" ...
$ Max.Sea.Level.PressureIn : chr "30.45" "29.58" "29.81" "29.88" ...
$ Max.TemperatureF : chr "64" "48" "39" "39" ...
$ Max.VisibilityMiles : chr "10" "10" "10" "10" ...
$ Max.Wind.SpeedMPH : chr "22" "23" "21" "16" ...
$ Mean.Humidity : chr "63" "95" "87" "75" ...
$ Mean.Sea.Level.PressureIn: chr "30.13" "29.5" "29.61" "29.85" ...
$ Mean.TemperatureF : chr "52" "43" "36" "35" ...
$ Mean.VisibilityMiles : chr "10" "3" "7" "10" ...
$ Mean.Wind.SpeedMPH : chr "13" "13" "13" "11" ...
$ MeanDew.PointF : chr "40" "39" "31" "27" ...
$ Min.DewpointF : chr "26" "37" "27" "25" ...
$ Min.Humidity : chr "52" "89" "82" "64" ...
$ Min.Sea.Level.PressureIn : chr "30.01" "29.43" "29.44" "29.81" ...
$ Min.TemperatureF : chr "39" "38" "32" "31" ...
$ Min.VisibilityMiles : chr "10" "1" "1" "7" ...
$ PrecipitationIn : chr "0.01" "0.28" "0.02" "T" ...
$ WindDirDegrees : chr "268" "357" "230" "286" ...| date | Events | CloudCover | Max.Dew.PointF | Max.Gust.SpeedMPH | Max.Humidity | Max.Sea.Level.PressureIn | Max.TemperatureF | Max.VisibilityMiles | Max.Wind.SpeedMPH | ... | Mean.VisibilityMiles | Mean.Wind.SpeedMPH | MeanDew.PointF | Min.DewpointF | Min.Humidity | Min.Sea.Level.PressureIn | Min.TemperatureF | Min.VisibilityMiles | PrecipitationIn | WindDirDegrees |
|---|---|---|---|---|---|---|---|---|---|---|---|---|---|---|---|---|---|---|---|---|
| 2014-12-01 | Rain | 6 | 46 | 29 | 74 | 30.45 | 64 | 10 | 22 | ... | 10 | 13 | 40 | 26 | 52 | 30.01 | 39 | 10 | 0.01 | 268 |
| 2014-12-10 | Rain | 8 | 45 | 29 | 100 | 29.58 | 48 | 10 | 23 | ... | 3 | 13 | 39 | 37 | 89 | 29.43 | 38 | 1 | 0.28 | 357 |
| 2014-12-11 | Rain-Snow | 8 | 37 | 28 | 92 | 29.81 | 39 | 10 | 21 | ... | 7 | 13 | 31 | 27 | 82 | 29.44 | 32 | 1 | 0.02 | 230 |
| 2014-12-12 | Snow | 7 | 28 | 21 | 85 | 29.88 | 39 | 10 | 16 | ... | 10 | 11 | 27 | 25 | 64 | 29.81 | 31 | 7 | T | 286 |
| 2014-12-13 | 5 | 28 | 23 | 75 | 29.86 | 42 | 10 | 17 | ... | 10 | 12 | 26 | 24 | 55 | 29.78 | 32 | 10 | T | 298 | |
| 2014-12-14 | 4 | 29 | 20 | 82 | 29.91 | 45 | 10 | 15 | ... | 10 | 10 | 27 | 25 | 53 | 29.78 | 33 | 10 | 0.00 | 306 | |
| 2014-12-15 | 2 | 33 | 21 | 89 | 30.15 | 42 | 10 | 15 | ... | 10 | 6 | 29 | 27 | 60 | 29.91 | 32 | 10 | 0.00 | 324 | |
| 2014-12-16 | Rain | 8 | 42 | 10 | 96 | 30.17 | 44 | 10 | 8 | ... | 9 | 4 | 36 | 30 | 73 | 29.92 | 35 | 5 | T | 79 |
| 2014-12-17 | Rain | 8 | 46 | 26 | 100 | 29.91 | 49 | 10 | 20 | ... | 6 | 11 | 41 | 32 | 70 | 29.69 | 41 | 1 | 0.43 | 311 |
| 2014-12-18 | Rain | 7 | 34 | 30 | 89 | 29.87 | 44 | 10 | 23 | ... | 10 | 14 | 30 | 26 | 57 | 29.71 | 36 | 10 | 0.01 | 281 |
| 2014-12-19 | 4 | 25 | 23 | 69 | 30.15 | 37 | 10 | 17 | ... | 10 | 11 | 22 | 20 | 56 | 29.86 | 29 | 10 | 0.00 | 305 | |
| 2014-12-02 | Rain-Snow | 7 | 40 | 29 | 92 | 30.71 | 42 | 10 | 24 | ... | 8 | 15 | 27 | 17 | 51 | 30.4 | 33 | 2 | 0.10 | 62 |
| 2014-12-20 | Snow | 6 | 30 | 26 | 89 | 30.31 | 36 | 10 | 21 | ... | 10 | 10 | 24 | 20 | 69 | 30.17 | 27 | 7 | T | 350 |
| 2014-12-21 | Snow | 8 | 30 | 20 | 85 | 30.37 | 36 | 10 | 16 | ... | 9 | 9 | 27 | 25 | 69 | 30.28 | 30 | 6 | T | 2 |
| 2014-12-22 | Rain | 7 | 39 | 22 | 89 | 30.4 | 44 | 10 | 18 | ... | 10 | 8 | 34 | 25 | 69 | 30.3 | 33 | 4 | 0.05 | 24 |
| 2014-12-23 | Rain | 8 | 45 | 25 | 100 | 30.31 | 47 | 10 | 20 | ... | 5 | 13 | 42 | 37 | 82 | 30.16 | 42 | 1 | 0.25 | 63 |
| 2014-12-24 | Fog-Rain | 8 | 46 | 15 | 100 | 30.13 | 46 | 2 | 13 | ... | 1 | 6 | 44 | 41 | 96 | 29.55 | 41 | 0 | 0.56 | 12 |
| 2014-12-25 | Rain | 6 | 58 | 40 | 100 | 29.96 | 59 | 10 | 28 | ... | 8 | 14 | 43 | 29 | 49 | 29.47 | 44 | 1 | 0.14 | 250 |
| 2014-12-26 | 1 | 31 | 25 | 70 | 30.16 | 50 | 10 | 18 | ... | 10 | 11 | 29 | 28 | 49 | 29.99 | 37 | 10 | 0.00 | 255 | |
| 2014-12-27 | 3 | 34 | 21 | 70 | 30.22 | 52 | 10 | 17 | ... | 10 | 9 | 31 | 29 | 50 | 30.03 | 38 | 10 | 0.00 | 251 |
Warning message in eval(expr, envir, enclos):
"NAs introduced by coercion"- 0.01
- 0.28
- 0.02
- <NA>
- <NA>
- 0
- 0
- <NA>
- 0.43
- 0.01
- 0
- 0.1
- <NA>
- <NA>
- 0.05
- 0.25
- 0.56
- 0.14
- 0
- 0
- 0.01
- 0
- 0.44
- 0
- 0
- 0
- 0.11
- 1.09
- 0.13
- 0.03
- 2.9
- 0
- 0
- 0
- 0.2
- 0
- <NA>
- 0.12
- 0
- 0
- 0.15
- 0
- 0
- 0
- 0
- <NA>
- 0
- 0.71
- 0
- 0.1
- 0.95
- 0.01
- <NA>
- 0.62
- 0.06
- 0.05
- 0.57
- 0
- 0.02
- <NA>
- 0
- 0.01
- 0
- 0.05
- 0.01
- 0.03
- 0
- 0.23
- 0.39
- 0
- 0.02
- 0.01
- 0.06
- 0.78
- 0
- 0.17
- 0.11
- 0
- <NA>
- 0.07
- 0.02
- 0
- 0
- 0
- 0
- 0.09
- <NA>
- 0.07
- 0.37
- 0.88
- 0.17
- 0.06
- 0.01
- 0
- 0
- 0.8
- 0.27
- 0
- 0.14
- 0
- 0
- 0.01
- 0.05
- 0.09
- 0
- 0
- 0
- 0.04
- 0.8
- 0.21
- 0.12
- 0
- 0.26
- <NA>
- 0
- 0.02
- <NA>
- 0
- 0
- <NA>
- 0
- 0
- 0.09
- 0
- 0
- 0
- 0.01
- 0
- 0
- 0.06
- 0
- 0
- 0
- 0.61
- 0.54
- <NA>
- 0
- <NA>
- 0
- 0
- 0.1
- 0.07
- 0
- 0.03
- 0
- 0.39
- 0
- 0
- 0.03
- 0.26
- 0.09
- 0
- 0
- 0
- 0.02
- 0
- 0
- 0
- <NA>
- 0
- 0
- 0.27
- 0
- 0
- 0
- <NA>
- 0
- 0
- <NA>
- 0
- 0
- <NA>
- 0
- 0
- 0
- 0.91
- 0
- 0.02
- 0
- 0
- 0
- 0
- 0.38
- 0
- 0
- 0
- <NA>
- 0
- 0.4
- <NA>
- 0
- 0
- 0
- 0.74
- 0.04
- 1.72
- 0
- 0.01
- 0
- 0
- <NA>
- 0.2
- 1.43
- <NA>
- 0
- 0
- 0
- <NA>
- 0.09
- 0
- <NA>
- <NA>
- 0.5
- 1.12
- 0
- 0
- 0
- 0.03
- <NA>
- 0
- <NA>
- 0.14
- <NA>
- 0
- <NA>
- <NA>
- 0
- 0
- 0.01
- 0
- <NA>
- 0.06
- 0
- 0
- 0
- 0.02
- 0
- <NA>
- 0
- 0
- 0.02
- <NA>
- 0.15
- <NA>
- 0
- 0.83
- 0
- 0
- 0
- 0.08
- 0
- 0
- 0.14
- 0
- 0
- 0
- 0.63
- <NA>
- 0.02
- <NA>
- 0
- <NA>
- 0
- 0
- 0
- 0
- 0
- 0
- 0.49
- 0
- 0
- 0
- 0
- 0
- 0
- 0.17
- 0.66
- 0.01
- 0.38
- 0
- 0
- 0
- 0
- 0
- 0
- 0
- <NA>
- 0
- 0
- 0
- 0
- 0
- 0
- 0
- 0
- 0.04
- 0.01
- 2.46
- <NA>
- 0
- 0
- 0
- 0.2
- 0
- <NA>
- 0
- 0
- 0
- 0.12
- 0
- 0
- <NA>
- <NA>
- <NA>
- 0
- 0.08
- <NA>
- 0.07
- <NA>
- 0
- 0
- 0.03
- 0
- 0
- 0.36
- 0.73
- 0.01
- 0
- 0
- 0
- 0
- 0
- 0
- 0
- 0.34
- <NA>
- 0.07
- 0.54
- 0.04
- 0.01
- 0
- 0
- 0
- 0
- 0
- <NA>
- 0
- 0.86
- 0
- 0.3
- 0.04
- 0
- 0
- 0
- 0
- 0.21
- 0
- 0
- 0
- 0
- 0
- 0
- 0
- 0
- 0
- 0.14
Column type conversions
"T" was used to denote a trace amount (i.e. too small to be accurately measured) of precipitation in the PrecipitationIn column. In order to coerce this column to numeric, wwe’ll need to deal with this somehow. To keep things simple, we will just replace "T" with zero, as a string ("0").
# Replace "T" with "0" (T = trace)
weather5$PrecipitationIn <- str_replace(weather5$PrecipitationIn, "T", "0")

# Convert characters to numerics
weather6 <- mutate_at(weather5, vars(CloudCover:WindDirDegrees), funs(as.numeric))

# Look at result
str(weather6)
Warning message:
"`funs()` is deprecated as of dplyr 0.8.0.
Please use a list of either functions or lambdas:
# Simple named list:
list(mean = mean, median = median)
# Auto named with `tibble::lst()`:
tibble::lst(mean, median)
# Using lambdas
list(~ mean(., trim = .2), ~ median(., na.rm = TRUE))
This warning is displayed once every 8 hours.
Call `lifecycle::last_warnings()` to see where this warning was generated."'data.frame': 366 obs. of 23 variables:
$ date : Date, format: "2014-12-01" "2014-12-10" ...
$ Events : chr "Rain" "Rain" "Rain-Snow" "Snow" ...
$ CloudCover : num 6 8 8 7 5 4 2 8 8 7 ...
$ Max.Dew.PointF : num 46 45 37 28 28 29 33 42 46 34 ...
$ Max.Gust.SpeedMPH : num 29 29 28 21 23 20 21 10 26 30 ...
$ Max.Humidity : num 74 100 92 85 75 82 89 96 100 89 ...
$ Max.Sea.Level.PressureIn : num 30.4 29.6 29.8 29.9 29.9 ...
$ Max.TemperatureF : num 64 48 39 39 42 45 42 44 49 44 ...
$ Max.VisibilityMiles : num 10 10 10 10 10 10 10 10 10 10 ...
$ Max.Wind.SpeedMPH : num 22 23 21 16 17 15 15 8 20 23 ...
$ Mean.Humidity : num 63 95 87 75 65 68 75 85 85 73 ...
$ Mean.Sea.Level.PressureIn: num 30.1 29.5 29.6 29.9 29.8 ...
$ Mean.TemperatureF : num 52 43 36 35 37 39 37 40 45 40 ...
$ Mean.VisibilityMiles : num 10 3 7 10 10 10 10 9 6 10 ...
$ Mean.Wind.SpeedMPH : num 13 13 13 11 12 10 6 4 11 14 ...
$ MeanDew.PointF : num 40 39 31 27 26 27 29 36 41 30 ...
$ Min.DewpointF : num 26 37 27 25 24 25 27 30 32 26 ...
$ Min.Humidity : num 52 89 82 64 55 53 60 73 70 57 ...
$ Min.Sea.Level.PressureIn : num 30 29.4 29.4 29.8 29.8 ...
$ Min.TemperatureF : num 39 38 32 31 32 33 32 35 41 36 ...
$ Min.VisibilityMiles : num 10 1 1 7 10 10 10 5 1 10 ...
$ PrecipitationIn : num 0.01 0.28 0.02 0 0 0 0 0 0.43 0.01 ...
$ WindDirDegrees : num 268 357 230 286 298 306 324 79 311 281 ...It looks like our data are finally in the correct formats and organized in a logical manner! Now that our data are in the right form, we can begin the analysis.
Missing, extreme, and unexpected values
Find missing values
Before dealing with missing values in the data, it’s important to find them and figure out why they exist in the first place.
If the dataset is too big to look at all at once, like it is here, we will use
sum()andis.na()to quickly size up the situation by counting the number of NA values.
The summary() function also come in handy for identifying which variables contain the missing values. Finally, the which() function is useful for locating the missing values within a particular column.
# Count missing values
sum(is.na(weather6))

# Find missing values
summary(weather6)

# Find indices of NAs in Max.Gust.SpeedMPH
ind <- which(is.na(weather6$Max.Gust.SpeedMPH))

# Look at the full rows for records missing Max.Gust.SpeedMPH
weather6[ind, ]
6
      date               Events            CloudCover    Max.Dew.PointF
 Min.   :2014-12-01   Length:366         Min.   :0.000   Min.   :-6.00
 1st Qu.:2015-03-02   Class :character   1st Qu.:3.000   1st Qu.:32.00
 Median :2015-06-01   Mode  :character   Median :5.000   Median :47.50
 Mean   :2015-06-01                      Mean   :4.708   Mean   :45.48
 3rd Qu.:2015-08-31                      3rd Qu.:7.000   3rd Qu.:61.00
 Max.   :2015-12-01                      Max.   :8.000   Max.   :75.00

 Max.Gust.SpeedMPH  Max.Humidity     Max.Sea.Level.PressureIn Max.TemperatureF
 Min.   : 0.00     Min.   :  39.00   Min.   :29.58            Min.   :18.00
 1st Qu.:21.00     1st Qu.:  73.25   1st Qu.:30.00            1st Qu.:42.00
 Median :25.50     Median :  86.00   Median :30.14            Median :60.00
 Mean   :26.99     Mean   :  85.69   Mean   :30.16            Mean   :58.93
 3rd Qu.:31.25     3rd Qu.:  93.00   3rd Qu.:30.31            3rd Qu.:76.00
 Max.   :94.00     Max.   :1000.00   Max.   :30.88            Max.   :96.00
 NA's   :6
 Max.VisibilityMiles Max.Wind.SpeedMPH Mean.Humidity
 Min.   : 2.000      Min.   : 8.00     Min.   :28.00
 1st Qu.:10.000      1st Qu.:16.00     1st Qu.:56.00
 Median :10.000      Median :20.00     Median :66.00
 Mean   : 9.907      Mean   :20.62     Mean   :66.02
 3rd Qu.:10.000      3rd Qu.:24.00     3rd Qu.:76.75
 Max.   :10.000      Max.   :38.00     Max.   :98.00

 Mean.Sea.Level.PressureIn Mean.TemperatureF Mean.VisibilityMiles
 Min.   :29.49             Min.   : 8.00     Min.   :-1.000
 1st Qu.:29.87             1st Qu.:36.25     1st Qu.: 8.000
 Median :30.03             Median :53.50     Median :10.000
 Mean   :30.04             Mean   :51.40     Mean   : 8.861
 3rd Qu.:30.19             3rd Qu.:68.00     3rd Qu.:10.000
 Max.   :30.77             Max.   :84.00     Max.   :10.000

 Mean.Wind.SpeedMPH MeanDew.PointF   Min.DewpointF     Min.Humidity
 Min.   : 4.00      Min.   :-11.00   Min.   :-18.00   Min.   :16.00
 1st Qu.: 8.00      1st Qu.: 24.00   1st Qu.: 16.25   1st Qu.:35.00
 Median :10.00      Median : 41.00   Median : 35.00   Median :46.00
 Mean   :10.68      Mean   : 38.96   Mean   : 32.25   Mean   :48.31
 3rd Qu.:13.00      3rd Qu.: 56.00   3rd Qu.: 51.00   3rd Qu.:60.00
 Max.   :22.00      Max.   : 71.00   Max.   : 68.00   Max.   :96.00

 Min.Sea.Level.PressureIn Min.TemperatureF Min.VisibilityMiles PrecipitationIn
 Min.   :29.16            Min.   :-3.00    Min.   : 0.000      Min.   :0.0000
 1st Qu.:29.76            1st Qu.:30.00    1st Qu.: 2.000      1st Qu.:0.0000
 Median :29.94            Median :46.00    Median :10.000      Median :0.0000
 Mean   :29.93            Mean   :43.33    Mean   : 6.716      Mean   :0.1016
 3rd Qu.:30.09            3rd Qu.:60.00    3rd Qu.:10.000      3rd Qu.:0.0400
 Max.   :30.64            Max.   :74.00    Max.   :10.000      Max.   :2.9000

 WindDirDegrees
 Min.   :  1.0
 1st Qu.:113.0
 Median :222.0
 Mean   :200.1
 3rd Qu.:275.0
 Max.   :360.0
| date | Events | CloudCover | Max.Dew.PointF | Max.Gust.SpeedMPH | Max.Humidity | Max.Sea.Level.PressureIn | Max.TemperatureF | Max.VisibilityMiles | Max.Wind.SpeedMPH | ... | Mean.VisibilityMiles | Mean.Wind.SpeedMPH | MeanDew.PointF | Min.DewpointF | Min.Humidity | Min.Sea.Level.PressureIn | Min.TemperatureF | Min.VisibilityMiles | PrecipitationIn | WindDirDegrees | |
|---|---|---|---|---|---|---|---|---|---|---|---|---|---|---|---|---|---|---|---|---|---|
| 161 | 2015-05-18 | Fog | 6 | 52 | NA | 100 | 30.30 | 58 | 10 | 16 | ... | 8 | 10 | 48 | 43 | 57 | 30.12 | 49 | 0 | 0 | 72 |
| 205 | 2015-06-03 | 7 | 48 | NA | 93 | 30.31 | 56 | 10 | 14 | ... | 10 | 7 | 45 | 43 | 71 | 30.19 | 47 | 10 | 0 | 90 | |
| 273 | 2015-08-08 | 4 | 61 | NA | 87 | 30.02 | 76 | 10 | 14 | ... | 10 | 6 | 57 | 54 | 49 | 29.95 | 61 | 10 | 0 | 45 | |
| 275 | 2015-09-01 | 1 | 63 | NA | 78 | 30.06 | 79 | 10 | 15 | ... | 10 | 9 | 62 | 59 | 52 | 29.96 | 69 | 10 | 0 | 54 | |
| 308 | 2015-10-12 | 0 | 56 | NA | 89 | 29.86 | 76 | 10 | 15 | ... | 10 | 8 | 51 | 48 | 41 | 29.74 | 51 | 10 | 0 | 199 | |
| 358 | 2015-11-03 | 1 | 44 | NA | 82 | 30.25 | 73 | 10 | 16 | ... | 10 | 8 | 42 | 40 | 31 | 30.06 | 47 | 10 | 0 | 281 |
In this situation it’s unclear why these values are missing and there doesn’t appear to be any obvious pattern to their missingness, so we’ll leave them alone for now.
An obvious error
Besides missing values, we want to know if there are values in the data that are too extreme or bizarre to be plausible. A great way to start the search for these values is with summary().
Once implausible values are identified, they must be dealt with in an intelligent and informed way.
Sometimes the best way forward is obvious and other times it may require some research and/or discussions with the original collectors of the data.
# Review distributions for all variables
summary(weather6)

# Find row with Max.Humidity of 1000
ind <- which(weather6$Max.Humidity==1000)

# Look at the data for that day
weather6[ind, ]

# Change 1000 to 100
weather6$Max.Humidity[ind] <- 100
date Events CloudCover Max.Dew.PointF
Min. :2014-12-01 Length:366 Min. :0.000 Min. :-6.00
1st Qu.:2015-03-02 Class :character 1st Qu.:3.000 1st Qu.:32.00
Median :2015-06-01 Mode :character Median :5.000 Median :47.50
Mean :2015-06-01 Mean :4.708 Mean :45.48
3rd Qu.:2015-08-31 3rd Qu.:7.000 3rd Qu.:61.00
Max. :2015-12-01 Max. :8.000 Max. :75.00
Max.Gust.SpeedMPH Max.Humidity Max.Sea.Level.PressureIn Max.TemperatureF
Min. : 0.00 Min. : 39.00 Min. :29.58 Min. :18.00
1st Qu.:21.00 1st Qu.: 73.25 1st Qu.:30.00 1st Qu.:42.00
Median :25.50 Median : 86.00 Median :30.14 Median :60.00
Mean :26.99 Mean : 85.69 Mean :30.16 Mean :58.93
3rd Qu.:31.25 3rd Qu.: 93.00 3rd Qu.:30.31 3rd Qu.:76.00
Max. :94.00 Max. :1000.00 Max. :30.88 Max. :96.00
NA's :6
Max.VisibilityMiles Max.Wind.SpeedMPH Mean.Humidity
Min. : 2.000 Min. : 8.00 Min. :28.00
1st Qu.:10.000 1st Qu.:16.00 1st Qu.:56.00
Median :10.000 Median :20.00 Median :66.00
Mean : 9.907 Mean :20.62 Mean :66.02
3rd Qu.:10.000 3rd Qu.:24.00 3rd Qu.:76.75
Max. :10.000 Max. :38.00 Max. :98.00
Mean.Sea.Level.PressureIn Mean.TemperatureF Mean.VisibilityMiles
Min. :29.49 Min. : 8.00 Min. :-1.000
1st Qu.:29.87 1st Qu.:36.25 1st Qu.: 8.000
Median :30.03 Median :53.50 Median :10.000
Mean :30.04 Mean :51.40 Mean : 8.861
3rd Qu.:30.19 3rd Qu.:68.00 3rd Qu.:10.000
Max. :30.77 Max. :84.00 Max. :10.000
Mean.Wind.SpeedMPH MeanDew.PointF Min.DewpointF Min.Humidity
Min. : 4.00 Min. :-11.00 Min. :-18.00 Min. :16.00
1st Qu.: 8.00 1st Qu.: 24.00 1st Qu.: 16.25 1st Qu.:35.00
Median :10.00 Median : 41.00 Median : 35.00 Median :46.00
Mean :10.68 Mean : 38.96 Mean : 32.25 Mean :48.31
3rd Qu.:13.00 3rd Qu.: 56.00 3rd Qu.: 51.00 3rd Qu.:60.00
Max. :22.00 Max. : 71.00 Max. : 68.00 Max. :96.00
Min.Sea.Level.PressureIn Min.TemperatureF Min.VisibilityMiles PrecipitationIn
Min. :29.16 Min. :-3.00 Min. : 0.000 Min. :0.0000
1st Qu.:29.76 1st Qu.:30.00 1st Qu.: 2.000 1st Qu.:0.0000
Median :29.94 Median :46.00 Median :10.000 Median :0.0000
Mean :29.93 Mean :43.33 Mean : 6.716 Mean :0.1016
3rd Qu.:30.09 3rd Qu.:60.00 3rd Qu.:10.000 3rd Qu.:0.0400
Max. :30.64 Max. :74.00 Max. :10.000 Max. :2.9000
WindDirDegrees
Min. : 1.0
1st Qu.:113.0
Median :222.0
Mean :200.1
3rd Qu.:275.0
Max. :360.0
| date | Events | CloudCover | Max.Dew.PointF | Max.Gust.SpeedMPH | Max.Humidity | Max.Sea.Level.PressureIn | Max.TemperatureF | Max.VisibilityMiles | Max.Wind.SpeedMPH | ... | Mean.VisibilityMiles | Mean.Wind.SpeedMPH | MeanDew.PointF | Min.DewpointF | Min.Humidity | Min.Sea.Level.PressureIn | Min.TemperatureF | Min.VisibilityMiles | PrecipitationIn | WindDirDegrees | |
|---|---|---|---|---|---|---|---|---|---|---|---|---|---|---|---|---|---|---|---|---|---|
| 135 | 2015-04-21 | Fog-Rain-Thunderstorm | 6 | 57 | 94 | 1000 | 29.75 | 65 | 10 | 20 | ... | 5 | 10 | 49 | 36 | 42 | 29.53 | 46 | 0 | 0.54 | 184 |
Once you find obvious errors, it’s not too hard to fix them if you know which values they should take.
Another obvious error
We’ve discovered and repaired one obvious error in the data, but it appears that there’s another. Sometimes we get lucky and can infer the correct or intended value from the other data. For example, if you know the minimum and maximum values of a particular metric on a given day…
# Look at summary of Mean.VisibilityMiles
summary(weather6$Mean.VisibilityMiles)

# Get index of row with -1 value
ind <- which(weather6$Mean.VisibilityMiles == -1)

# Look at full row
weather6[ind,]

# Set Mean.VisibilityMiles to the appropriate value
weather6$Mean.VisibilityMiles[ind] <- 10
Min. 1st Qu. Median Mean 3rd Qu. Max.
-1.000 8.000 10.000 8.861 10.000 10.000 | date | Events | CloudCover | Max.Dew.PointF | Max.Gust.SpeedMPH | Max.Humidity | Max.Sea.Level.PressureIn | Max.TemperatureF | Max.VisibilityMiles | Max.Wind.SpeedMPH | ... | Mean.VisibilityMiles | Mean.Wind.SpeedMPH | MeanDew.PointF | Min.DewpointF | Min.Humidity | Min.Sea.Level.PressureIn | Min.TemperatureF | Min.VisibilityMiles | PrecipitationIn | WindDirDegrees | |
|---|---|---|---|---|---|---|---|---|---|---|---|---|---|---|---|---|---|---|---|---|---|
| 192 | 2015-06-18 | 5 | 54 | 23 | 72 | 30.14 | 76 | 10 | 17 | ... | -1 | 10 | 49 | 45 | 46 | 29.93 | 57 | 10 | 0 | 189 |
Our data are looking tidy. Just a quick sanity check left!
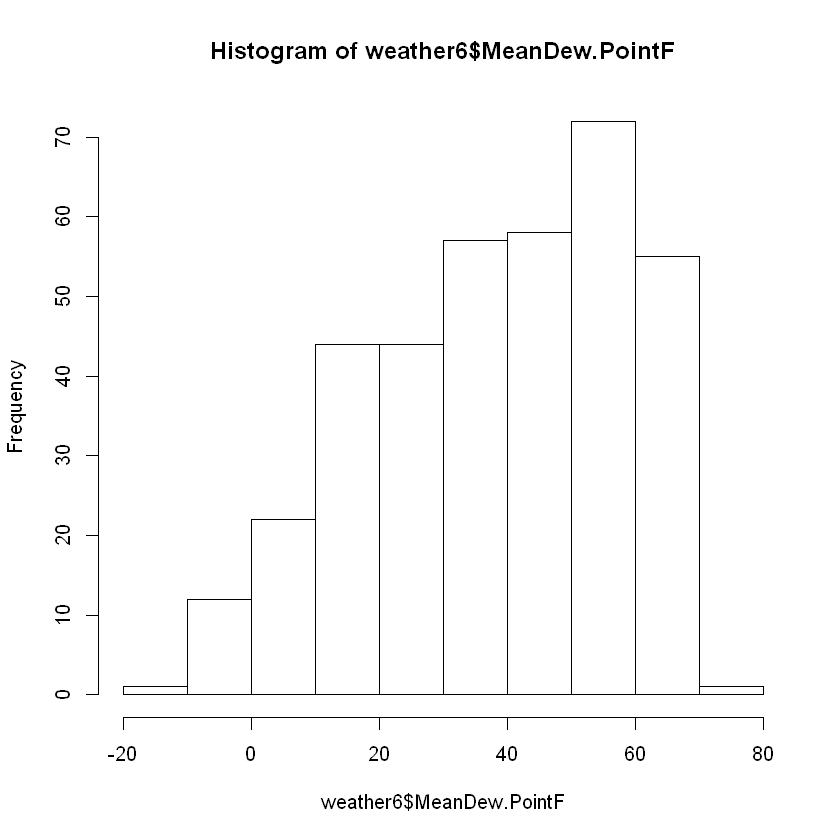
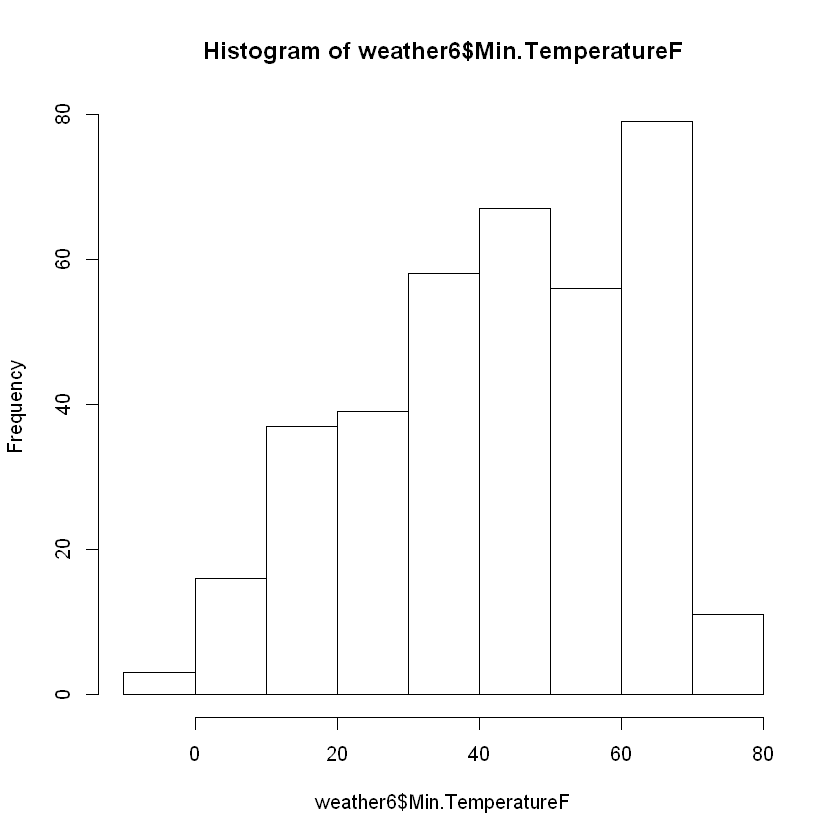
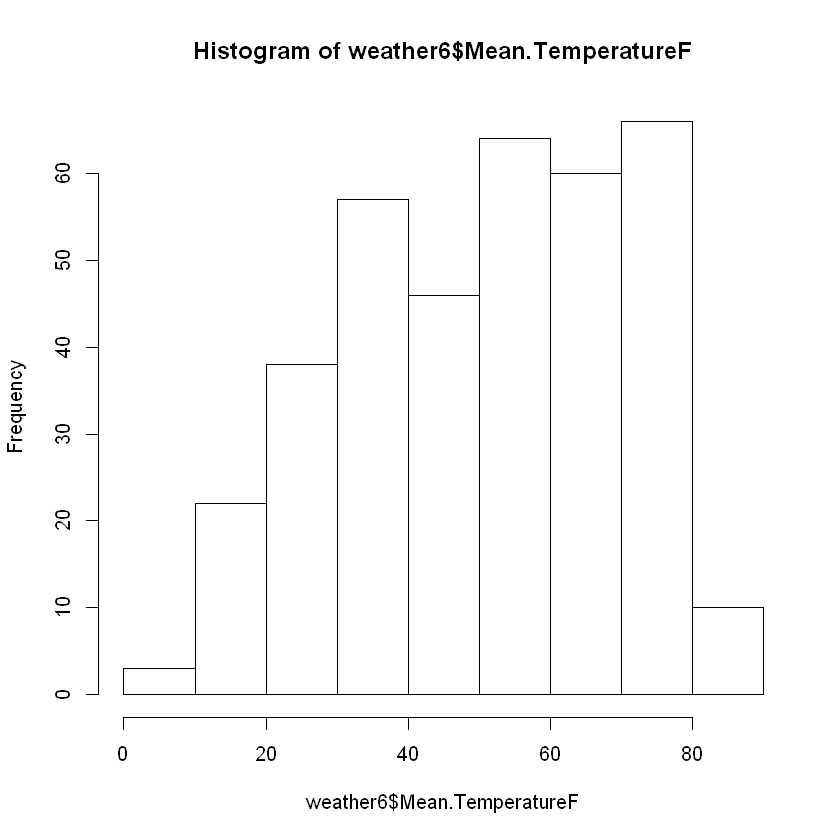
Check other extreme values
In addition to dealing with obvious errors in the data, we want to see if there are other extreme values. In addition to the trusty summary() function, hist() is useful for quickly getting a feel for how different variables are distributed.
# Review summary of full data once more
summary(weather6)

# Look at histogram for MeanDew.PointF
hist(weather6$MeanDew.PointF)

# Look at histogram for Min.TemperatureF
hist(weather6$Min.TemperatureF)

# Compare to histogram for Mean.TemperatureF
hist(weather6$Mean.TemperatureF)
date Events CloudCover Max.Dew.PointF
Min. :2014-12-01 Length:366 Min. :0.000 Min. :-6.00
1st Qu.:2015-03-02 Class :character 1st Qu.:3.000 1st Qu.:32.00
Median :2015-06-01 Mode :character Median :5.000 Median :47.50
Mean :2015-06-01 Mean :4.708 Mean :45.48
3rd Qu.:2015-08-31 3rd Qu.:7.000 3rd Qu.:61.00
Max. :2015-12-01 Max. :8.000 Max. :75.00
Max.Gust.SpeedMPH Max.Humidity Max.Sea.Level.PressureIn Max.TemperatureF
Min. : 0.00 Min. : 39.00 Min. :29.58 Min. :18.00
1st Qu.:21.00 1st Qu.: 73.25 1st Qu.:30.00 1st Qu.:42.00
Median :25.50 Median : 86.00 Median :30.14 Median :60.00
Mean :26.99 Mean : 83.23 Mean :30.16 Mean :58.93
3rd Qu.:31.25 3rd Qu.: 93.00 3rd Qu.:30.31 3rd Qu.:76.00
Max. :94.00 Max. :100.00 Max. :30.88 Max. :96.00
NA's :6
Max.VisibilityMiles Max.Wind.SpeedMPH Mean.Humidity
Min. : 2.000 Min. : 8.00 Min. :28.00
1st Qu.:10.000 1st Qu.:16.00 1st Qu.:56.00
Median :10.000 Median :20.00 Median :66.00
Mean : 9.907 Mean :20.62 Mean :66.02
3rd Qu.:10.000 3rd Qu.:24.00 3rd Qu.:76.75
Max. :10.000 Max. :38.00 Max. :98.00
Mean.Sea.Level.PressureIn Mean.TemperatureF Mean.VisibilityMiles
Min. :29.49 Min. : 8.00 Min. : 1.000
1st Qu.:29.87 1st Qu.:36.25 1st Qu.: 8.000
Median :30.03 Median :53.50 Median :10.000
Mean :30.04 Mean :51.40 Mean : 8.891
3rd Qu.:30.19 3rd Qu.:68.00 3rd Qu.:10.000
Max. :30.77 Max. :84.00 Max. :10.000
Mean.Wind.SpeedMPH MeanDew.PointF Min.DewpointF Min.Humidity
Min. : 4.00 Min. :-11.00 Min. :-18.00 Min. :16.00
1st Qu.: 8.00 1st Qu.: 24.00 1st Qu.: 16.25 1st Qu.:35.00
Median :10.00 Median : 41.00 Median : 35.00 Median :46.00
Mean :10.68 Mean : 38.96 Mean : 32.25 Mean :48.31
3rd Qu.:13.00 3rd Qu.: 56.00 3rd Qu.: 51.00 3rd Qu.:60.00
Max. :22.00 Max. : 71.00 Max. : 68.00 Max. :96.00
Min.Sea.Level.PressureIn Min.TemperatureF Min.VisibilityMiles PrecipitationIn
Min. :29.16 Min. :-3.00 Min. : 0.000 Min. :0.0000
1st Qu.:29.76 1st Qu.:30.00 1st Qu.: 2.000 1st Qu.:0.0000
Median :29.94 Median :46.00 Median :10.000 Median :0.0000
Mean :29.93 Mean :43.33 Mean : 6.716 Mean :0.1016
3rd Qu.:30.09 3rd Qu.:60.00 3rd Qu.:10.000 3rd Qu.:0.0400
Max. :30.64 Max. :74.00 Max. :10.000 Max. :2.9000
WindDirDegrees
Min. : 1.0
1st Qu.:113.0
Median :222.0
Mean :200.1
3rd Qu.:275.0
Max. :360.0
It looks like you have sufficiently tidied your data!
Finishing touches
Before officially calling our weather data clean, we want to put a couple of finishing touches on the data. These are a bit more subjective and may not be necessary for analysis, but they will make the data easier for others to interpret, which is generally a good thing.
There are a number of stylistic conventions in the R language. Depending on who you ask, these conventions may vary. Because the period (.) has special meaning in certain situations, we will be using underscores (_) to separate words in variable names. We also prefer all lowercase letters so that no one has to remember which letters are uppercase or lowercase.
Finally, the events column (renamed to be all lowercase in the first instruction) contains an empty string (““) for any day on which there was no significant weather event such as rain, fog, a thunderstorm, etc. However, if it’s the first time you’re seeing these data, it may not be obvious that this is the case, so it’s best for us to be explicit and replace the empty strings with something more meaningful.
new_colnames = c("date", "events",
                 "cloud_cover", "max_dew_point_f",
                 "max_gust_speed_mph", "max_humidity",
                 "max_sea_level_pressure_in", "max_temperature_f",
                 "max_visibility_miles", "max_wind_speed_mph",
                 "mean_humidity", "mean_sea_level_pressure_in",
                 "mean_temperature_f", "mean_visibility_miles",
                 "mean_wind_speed_mph", "mean_dew_point_f",
                 "min_dew_point_f", "min_humidity",
                 "min_sea_level_pressure_in", "min_temperature_f",
                 "min_visibility_miles", "precipitation_in","wind_dir_degrees")
# Clean up column names
names(weather6) <- new_colnames
# Replace empty cells in events column
weather6$events[weather6$events == ""] <- "None"
# Print the first 6 rows of weather6
head(weather6)| date | events | cloud_cover | max_dew_point_f | max_gust_speed_mph | max_humidity | max_sea_level_pressure_in | max_temperature_f | max_visibility_miles | max_wind_speed_mph | ... | mean_visibility_miles | mean_wind_speed_mph | mean_dew_point_f | min_dew_point_f | min_humidity | min_sea_level_pressure_in | min_temperature_f | min_visibility_miles | precipitation_in | wind_dir_degrees |
|---|---|---|---|---|---|---|---|---|---|---|---|---|---|---|---|---|---|---|---|---|
| 2014-12-01 | Rain | 6 | 46 | 29 | 74 | 30.45 | 64 | 10 | 22 | ... | 10 | 13 | 40 | 26 | 52 | 30.01 | 39 | 10 | 0.01 | 268 |
| 2014-12-10 | Rain | 8 | 45 | 29 | 100 | 29.58 | 48 | 10 | 23 | ... | 3 | 13 | 39 | 37 | 89 | 29.43 | 38 | 1 | 0.28 | 357 |
| 2014-12-11 | Rain-Snow | 8 | 37 | 28 | 92 | 29.81 | 39 | 10 | 21 | ... | 7 | 13 | 31 | 27 | 82 | 29.44 | 32 | 1 | 0.02 | 230 |
| 2014-12-12 | Snow | 7 | 28 | 21 | 85 | 29.88 | 39 | 10 | 16 | ... | 10 | 11 | 27 | 25 | 64 | 29.81 | 31 | 7 | 0.00 | 286 |
| 2014-12-13 | None | 5 | 28 | 23 | 75 | 29.86 | 42 | 10 | 17 | ... | 10 | 12 | 26 | 24 | 55 | 29.78 | 32 | 10 | 0.00 | 298 |
| 2014-12-14 | None | 4 | 29 | 20 | 82 | 29.91 | 45 | 10 | 15 | ... | 10 | 10 | 27 | 25 | 53 | 29.78 | 33 | 10 | 0.00 | 306 |
tail(weather6)| date | events | cloud_cover | max_dew_point_f | max_gust_speed_mph | max_humidity | max_sea_level_pressure_in | max_temperature_f | max_visibility_miles | max_wind_speed_mph | ... | mean_visibility_miles | mean_wind_speed_mph | mean_dew_point_f | min_dew_point_f | min_humidity | min_sea_level_pressure_in | min_temperature_f | min_visibility_miles | precipitation_in | wind_dir_degrees | |
|---|---|---|---|---|---|---|---|---|---|---|---|---|---|---|---|---|---|---|---|---|---|
| 361 | 2015-11-05 | None | 4 | 61 | 31 | 100 | 30.30 | 76 | 10 | 22 | ... | 9 | 12 | 55 | 48 | 53 | 30.09 | 50 | 5 | 0.00 | 224 |
| 362 | 2015-11-06 | None | 4 | 62 | 32 | 93 | 30.07 | 73 | 10 | 26 | ... | 10 | 15 | 61 | 54 | 64 | 29.71 | 62 | 10 | 0.00 | 222 |
| 363 | 2015-11-07 | None | 6 | 45 | 33 | 57 | 30.02 | 69 | 10 | 25 | ... | 10 | 13 | 38 | 33 | 39 | 29.83 | 50 | 10 | 0.00 | 280 |
| 364 | 2015-11-08 | None | 0 | 34 | 25 | 65 | 30.38 | 56 | 10 | 18 | ... | 10 | 12 | 30 | 24 | 30 | 30.04 | 44 | 10 | 0.00 | 283 |
| 365 | 2015-11-09 | None | 2 | 36 | 20 | 70 | 30.43 | 60 | 10 | 16 | ... | 10 | 9 | 32 | 30 | 33 | 30.32 | 41 | 10 | 0.00 | 237 |
| 366 | 2015-12-01 | Rain | 7 | 43 | 17 | 96 | 30.40 | 45 | 10 | 15 | ... | 8 | 6 | 35 | 25 | 69 | 30.01 | 32 | 1 | 0.14 | 109 |
str(weather6)'data.frame': 366 obs. of 23 variables:
$ date : Date, format: "2014-12-01" "2014-12-10" ...
$ events : chr "Rain" "Rain" "Rain-Snow" "Snow" ...
$ cloud_cover : num 6 8 8 7 5 4 2 8 8 7 ...
$ max_dew_point_f : num 46 45 37 28 28 29 33 42 46 34 ...
$ max_gust_speed_mph : num 29 29 28 21 23 20 21 10 26 30 ...
$ max_humidity : num 74 100 92 85 75 82 89 96 100 89 ...
$ max_sea_level_pressure_in : num 30.4 29.6 29.8 29.9 29.9 ...
$ max_temperature_f : num 64 48 39 39 42 45 42 44 49 44 ...
$ max_visibility_miles : num 10 10 10 10 10 10 10 10 10 10 ...
$ max_wind_speed_mph : num 22 23 21 16 17 15 15 8 20 23 ...
$ mean_humidity : num 63 95 87 75 65 68 75 85 85 73 ...
$ mean_sea_level_pressure_in: num 30.1 29.5 29.6 29.9 29.8 ...
$ mean_temperature_f : num 52 43 36 35 37 39 37 40 45 40 ...
$ mean_visibility_miles : num 10 3 7 10 10 10 10 9 6 10 ...
$ mean_wind_speed_mph : num 13 13 13 11 12 10 6 4 11 14 ...
$ mean_dew_point_f : num 40 39 31 27 26 27 29 36 41 30 ...
$ min_dew_point_f : num 26 37 27 25 24 25 27 30 32 26 ...
$ min_humidity : num 52 89 82 64 55 53 60 73 70 57 ...
$ min_sea_level_pressure_in : num 30 29.4 29.4 29.8 29.8 ...
$ min_temperature_f : num 39 38 32 31 32 33 32 35 41 36 ...
$ min_visibility_miles : num 10 1 1 7 10 10 10 5 1 10 ...
$ precipitation_in : num 0.01 0.28 0.02 0 0 0 0 0 0.43 0.01 ...
$ wind_dir_degrees : num 268 357 230 286 298 306 324 79 311 281 ...glimpse(weather6)Rows: 366
Columns: 23
$ date <date> 2014-12-01, 2014-12-10, 2014-12-11, 201...
$ events <chr> "Rain", "Rain", "Rain-Snow", "Snow", "No...
$ cloud_cover <dbl> 6, 8, 8, 7, 5, 4, 2, 8, 8, 7, 4, 7, 6, 8...
$ max_dew_point_f <dbl> 46, 45, 37, 28, 28, 29, 33, 42, 46, 34, ...
$ max_gust_speed_mph <dbl> 29, 29, 28, 21, 23, 20, 21, 10, 26, 30, ...
$ max_humidity <dbl> 74, 100, 92, 85, 75, 82, 89, 96, 100, 89...
$ max_sea_level_pressure_in <dbl> 30.45, 29.58, 29.81, 29.88, 29.86, 29.91...
$ max_temperature_f <dbl> 64, 48, 39, 39, 42, 45, 42, 44, 49, 44, ...
$ max_visibility_miles <dbl> 10, 10, 10, 10, 10, 10, 10, 10, 10, 10, ...
$ max_wind_speed_mph <dbl> 22, 23, 21, 16, 17, 15, 15, 8, 20, 23, 1...
$ mean_humidity <dbl> 63, 95, 87, 75, 65, 68, 75, 85, 85, 73, ...
$ mean_sea_level_pressure_in <dbl> 30.13, 29.50, 29.61, 29.85, 29.82, 29.83...
$ mean_temperature_f <dbl> 52, 43, 36, 35, 37, 39, 37, 40, 45, 40, ...
$ mean_visibility_miles <dbl> 10, 3, 7, 10, 10, 10, 10, 9, 6, 10, 10, ...
$ mean_wind_speed_mph <dbl> 13, 13, 13, 11, 12, 10, 6, 4, 11, 14, 11...
$ mean_dew_point_f <dbl> 40, 39, 31, 27, 26, 27, 29, 36, 41, 30, ...
$ min_dew_point_f <dbl> 26, 37, 27, 25, 24, 25, 27, 30, 32, 26, ...
$ min_humidity <dbl> 52, 89, 82, 64, 55, 53, 60, 73, 70, 57, ...
$ min_sea_level_pressure_in <dbl> 30.01, 29.43, 29.44, 29.81, 29.78, 29.78...
$ min_temperature_f <dbl> 39, 38, 32, 31, 32, 33, 32, 35, 41, 36, ...
$ min_visibility_miles <dbl> 10, 1, 1, 7, 10, 10, 10, 5, 1, 10, 10, 2...
$ precipitation_in <dbl> 0.01, 0.28, 0.02, 0.00, 0.00, 0.00, 0.00...
$ wind_dir_degrees <dbl> 268, 357, 230, 286, 298, 306, 324, 79, 3...summary(weather6) date events cloud_cover max_dew_point_f
Min. :2014-12-01 Length:366 Min. :0.000 Min. :-6.00
1st Qu.:2015-03-02 Class :character 1st Qu.:3.000 1st Qu.:32.00
Median :2015-06-01 Mode :character Median :5.000 Median :47.50
Mean :2015-06-01 Mean :4.708 Mean :45.48
3rd Qu.:2015-08-31 3rd Qu.:7.000 3rd Qu.:61.00
Max. :2015-12-01 Max. :8.000 Max. :75.00
max_gust_speed_mph max_humidity max_sea_level_pressure_in
Min. : 0.00 Min. : 39.00 Min. :29.58
1st Qu.:21.00 1st Qu.: 73.25 1st Qu.:30.00
Median :25.50 Median : 86.00 Median :30.14
Mean :26.99 Mean : 83.23 Mean :30.16
3rd Qu.:31.25 3rd Qu.: 93.00 3rd Qu.:30.31
Max. :94.00 Max. :100.00 Max. :30.88
NA's :6
max_temperature_f max_visibility_miles max_wind_speed_mph mean_humidity
Min. :18.00 Min. : 2.000 Min. : 8.00 Min. :28.00
1st Qu.:42.00 1st Qu.:10.000 1st Qu.:16.00 1st Qu.:56.00
Median :60.00 Median :10.000 Median :20.00 Median :66.00
Mean :58.93 Mean : 9.907 Mean :20.62 Mean :66.02
3rd Qu.:76.00 3rd Qu.:10.000 3rd Qu.:24.00 3rd Qu.:76.75
Max. :96.00 Max. :10.000 Max. :38.00 Max. :98.00
mean_sea_level_pressure_in mean_temperature_f mean_visibility_miles
Min. :29.49 Min. : 8.00 Min. : 1.000
1st Qu.:29.87 1st Qu.:36.25 1st Qu.: 8.000
Median :30.03 Median :53.50 Median :10.000
Mean :30.04 Mean :51.40 Mean : 8.891
3rd Qu.:30.19 3rd Qu.:68.00 3rd Qu.:10.000
Max. :30.77 Max. :84.00 Max. :10.000
mean_wind_speed_mph mean_dew_point_f min_dew_point_f min_humidity
Min. : 4.00 Min. :-11.00 Min. :-18.00 Min. :16.00
1st Qu.: 8.00 1st Qu.: 24.00 1st Qu.: 16.25 1st Qu.:35.00
Median :10.00 Median : 41.00 Median : 35.00 Median :46.00
Mean :10.68 Mean : 38.96 Mean : 32.25 Mean :48.31
3rd Qu.:13.00 3rd Qu.: 56.00 3rd Qu.: 51.00 3rd Qu.:60.00
Max. :22.00 Max. : 71.00 Max. : 68.00 Max. :96.00
min_sea_level_pressure_in min_temperature_f min_visibility_miles
Min. :29.16 Min. :-3.00 Min. : 0.000
1st Qu.:29.76 1st Qu.:30.00 1st Qu.: 2.000
Median :29.94 Median :46.00 Median :10.000
Mean :29.93 Mean :43.33 Mean : 6.716
3rd Qu.:30.09 3rd Qu.:60.00 3rd Qu.:10.000
Max. :30.64 Max. :74.00 Max. :10.000
precipitation_in wind_dir_degrees
Min. :0.0000 Min. : 1.0
1st Qu.:0.0000 1st Qu.:113.0
Median :0.0000 Median :222.0
Mean :0.1016 Mean :200.1
3rd Qu.:0.0400 3rd Qu.:275.0
Max. :2.9000 Max. :360.0